Education
Comparing Two Nursing Programs? A Small Cohort's Pass Rate Swings on One Student
Licensure pass rates are the most trusted number in program shopping, and in a class of twenty-four a single result moves the figure by four points.
Rafael Quintanilla|
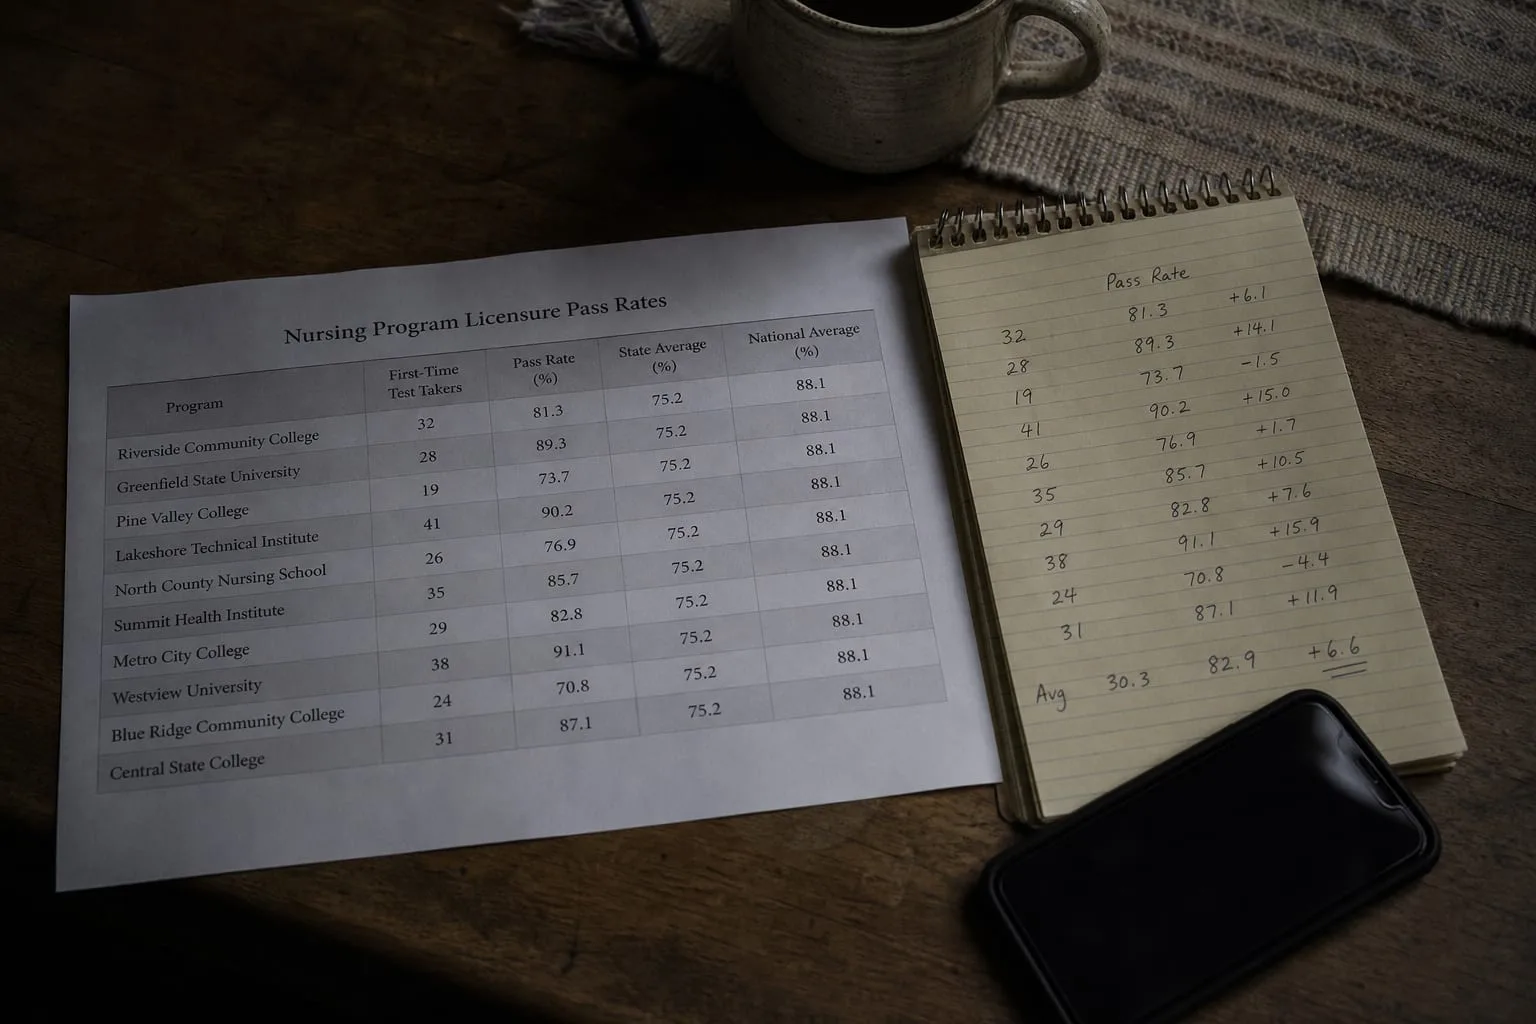
Two associate degree nursing programs sit forty minutes apart, both public, both roughly the same tuition, and both post a first-time licensure pass rate on the state board's website. One reports ninety-six percent. The other reports eighty-eight. A parent reading that table at the kitchen table treats the gap as eight points of quality, and enrollment counselors at the higher-scoring school are happy to leave that reading alone. The problem is arithmetic rather than honesty. The first program graduated twenty-four students that year and the second graduated three hundred, which means the two numbers were not built out of the same material and cannot be compared as though they were.
How the pass rate became the number everyone looks at
Program outcome reporting did not arrive all at once, and the licensure pass rate got its authority by being the oldest and cleanest thing on the list. State boards of nursing have long needed a trigger for putting a struggling program on warning status, and a first-time pass rate gave them one that was countable, annual, and hard to argue with. Accreditors adopted a similar benchmark for the same reason. Later layers, federal reporting on completion and cost, earnings data published after graduates start filing returns, arrived on top of a habit already formed. The U.S. Department of Education oversees the federal side of that disclosure system, and the result is a stack of numbers assembled by different bodies for different purposes and then read side by side as if they were one instrument.
What twenty-four graduates does to a percentage
In a cohort of twenty-four, one candidate is 4.2 percentage points. Two candidates who tested badly on a Tuesday, or who sat the exam late, or who had a newborn that spring, move the published figure by more than eight points without anything changing in the curriculum, the faculty, or the clinical placements. Run that same program for five consecutive years and the reported rate will bounce across a wide band while the underlying teaching stays flat. In a cohort of three hundred, one candidate is a third of a point, and the number holds still enough that a real change in instruction shows up as a real change on the table. This is the threshold that matters when you are comparing programs: somewhere above roughly a hundred test takers a year, the annual rate starts behaving like a measurement, and below about fifty it behaves like a coin toss with a good curriculum attached.
The comparison that actually tells you something
For the small program, the useful move is to stop reading one year and start reading five. Most state boards publish historical rates, and a program that sat at ninety-plus for four years and dropped once has a different story than one that has drifted down each year in a row. Ask the program director for the count of test takers behind each percentage, not just the percentage, because a rate without a denominator is a claim rather than a fact. For the large program, the annual figure is more trustworthy but hides internal variation, and the question worth asking there is whether the cohort is split across campuses, day and evening tracks, or a hybrid section, since a single published rate can average two very different student experiences into one reassuring number. The small program is easier to inspect in person and harder to measure on paper. The large one is the reverse.
The questions the table was never built to answer
First-time pass rates count only people who reached the exam, which means every student who left in the third semester is invisible in the figure that looks most like quality. A program can hold a high pass rate by counseling marginal students out before the final term, and nothing in the published number will show you that it happened. So ask for the completion rate alongside it, and ask how completion is defined, since a program that measures from the start of the clinical year rather than from the first day of prerequisites is reporting a shorter, kinder race. Ask where the clinical placements are, how many students share a preceptor, and whether the placement is guaranteed or subject to a hospital's capacity that fall. Those are the constraints that decide whether you finish on schedule, and they never appear in a rate.
Reading the two numbers together
Set the pass rate and the completion rate beside each other and the shape of a program comes into focus quickly. High pass rate with a low completion rate is a filter. Moderate pass rate with a high completion rate is a program that takes people through and lets the exam sort them, which for a student with a solid academic record and no interest in retaking anything may be the better bet. High on both, sustained across several years and several dozen test takers, is the combination worth paying attention to, and it is also the one small programs earn honestly and often go unrewarded for, because their sample is too small to look impressive twice in a row.
The eight-point gap in that table may be real. It may also be two students, one bad February, and a denominator small enough that the difference never existed. Finding out which takes one phone call and a request for five years of counts, and the program that answers that request in full has already told you a good deal about how it operates.